
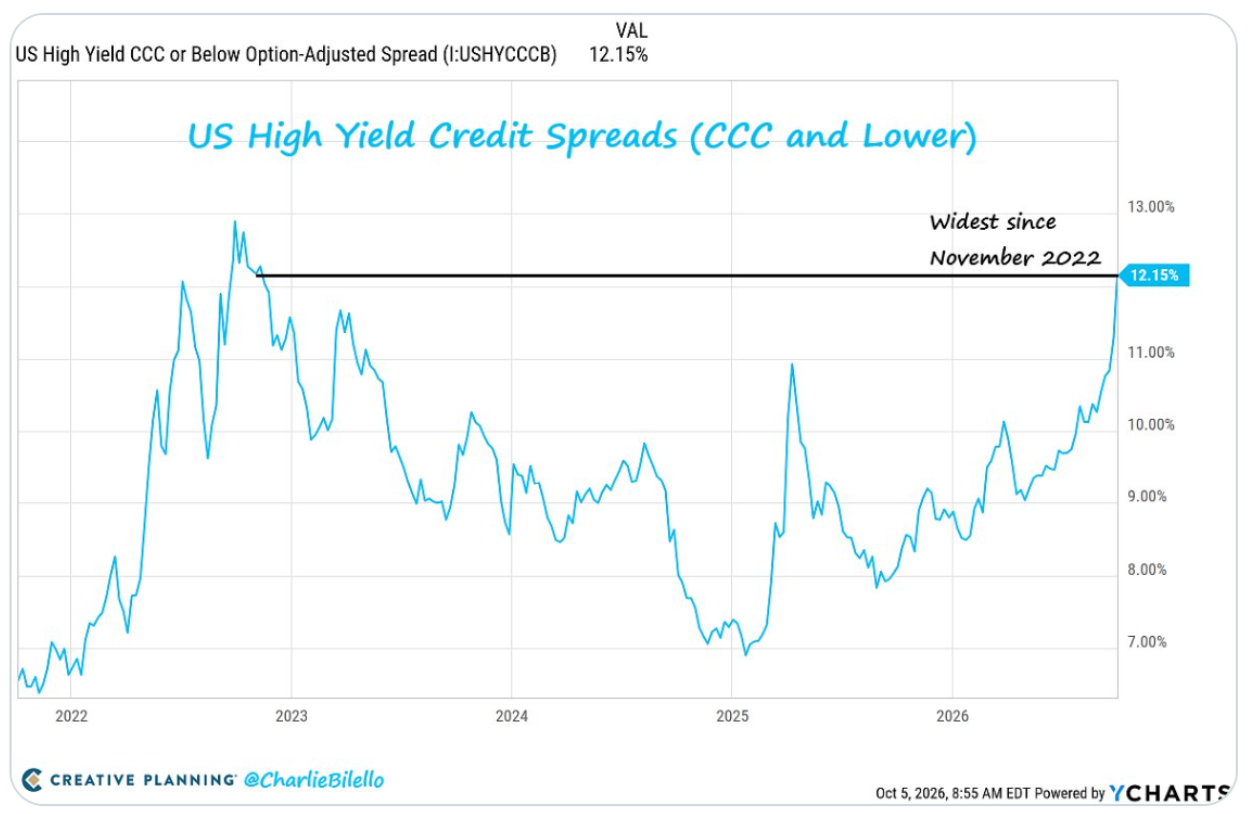
There are two very different markets right now. AI-related stocks are booming. However, credit spreads for the weakest US companies have blown out to 12.15%, their widest level in nearly four years. Check out this chart from Charlie Bilello:
What the chart shows
The line is the option-adjusted spread on CCC-and-lower rated high yield bonds, which is the riskiest corner of the corporate bond market. The highest yield, along with the highest investor risk. The spread bottomed near 7% in early 2025, spiked to about 11% that spring, and then settled back to roughly 8%. Since then it has climbed in a mostly steady line to 12.15% today, the widest since November 2022. The 2025 spike reversed quickly, and so far this move has not.
Why the two markets can diverge
The strongest and weakest companies are being priced as if they live in different economies. A few things can drive that:
- Rates are not friendly to weak borrowers. The 10-year yield is above 5%, and lower-rated companies have to refinance at whatever the market charges. The weakest borrowers feel that first.
- Strong companies can fund themselves. The biggest names have cash flow and market access, so a booming stock market doesn't depend on the health of the bottom of the credit ladder.
- Leverage cuts both ways. Companies carrying heavy debt loads are the ones for which a higher interest bill matters most.
Credit has a history of speaking first
Think back to the sequence we covered in the 2000/2007 piece. The market-top playbook ends with a credit event, and we noted that spreads widening is often the earliest warning that a credit problem is developing, usually before stocks fully react. In 2008, high yield spreads blew out to roughly 20 points over Treasuries while Treasuries rallied hard.
A CCC spread at 12.15% is high, but it's nowhere near crisis-era levels, and the chart itself shows the same measure at similar levels in late 2022 without the system falling apart.
What this could mean for fixed income investors
- Be careful reaching for yield. A 12% spread looks attractive until you remember what pays it. CCC bonds carry higher default risk, and the extra yield can disappear quickly if companies fail to refinance.
- Quality duration looks better by comparison. If credit stress spreads, Treasuries have historically been where capital flows. The TLT return tables we covered show how asymmetric that payoff can be.
- Check how much credit risk is hiding in your income funds. High yield, leveraged loans and private credit vehicles can hold exposure to the weakest borrowers. Floating-rate loans don't protect you if the borrower can't make the higher payments.
- Watch the broader spread, not only CCC. The next question is whether the widening stays confined to the bottom tier or starts to spread upward to BB and investment grade.
- Keep dry powder in T-bills. It fits what we noted about the record-low cash allocations. If the credit warning is right, the investors holding liquidity are the ones who can buy when others are forced to sell.
The caveat
CCC spreads are a noisy, volatile corner of the market, and they've widened without leading to a broader crisis before. The chart shows exactly that in 2022 and again in 2025. The more useful signal would be if the widening keeps going and spreads higher up the quality ladder..
The bottom line
Stocks are telling one story, and the weakest borrowers in the credit market are telling another. History says credit tends to be the more honest storyteller. Again, it is a reason to know how much credit risk your income portfolio is carrying, and whether you're being paid enough for it.