
The conversation will naturally focus on stocks. But who's left to buy bonds, and who will be forced to when the mood turns? Let’s dive in.
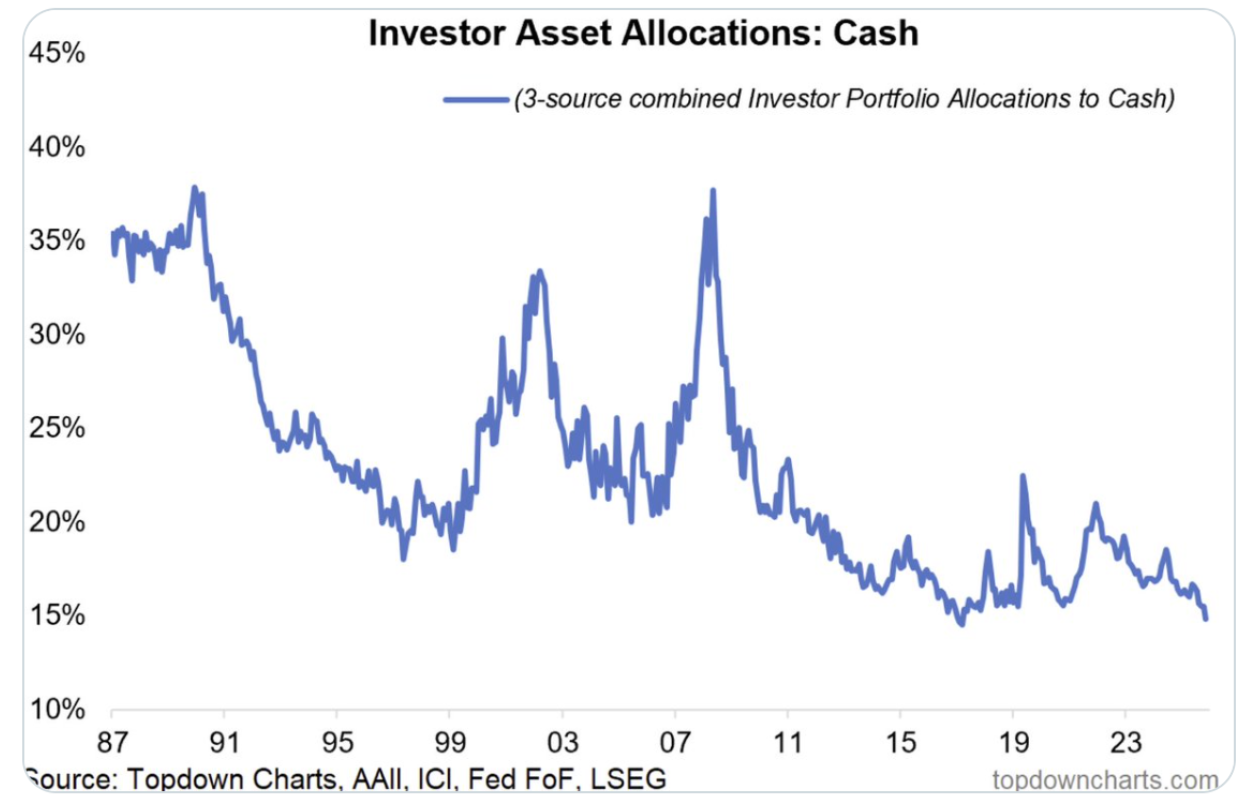
What the chart is telling us
The line combines three sources of investor portfolio allocations to cash (AAII, ICI and the Fed's flow of funds data). It sat in the mid-30s in the late 1980s, peaked near 38% around 1990, and has been drifting lower ever since, with spikes after each major scare. It rose to roughly 33% after the dot-com bust, and it jumped to the high 30s around the financial crisis. Today it's sitting around 15%, close to the lowest readings on the chart.
Cash allocations jump when investors are scared. The fully invested stretches are the ones that come before.
A trip down memory lane
2000. Cash allocations were already low and stocks were everywhere. The 10-year yield peaked early in the year, and stocks followed with a peak in March. Investors who owned Treasuries over the next few years watched their bonds rally while equities fell. It was the first time a generation learned that the boring part of the portfolio could be the part that paid the bills.
2008. This is the one every fixed income investor should keep in mind. When the crisis hit, Treasuries rallied hard while high yield spreads blew out to roughly 20 points over Treasuries. The assets that suffered were the ones carrying credit risk. Then look at the chart: cash allocations spiked to the high 30s right around the point of maximum fear. The moment investors finally wanted cash was close to the moment the selling was nearly done.
Now, picture two investors today. One is fully invested in stocks and credit with almost no cash. The other has kept a slice of the portfolio in T-bills, which were paying around 4% earlier this year. When a sudden drop arrives, the first has to decide what to sell at a loss to raise money. The second just lets bills mature, and can buy bonds or stocks that have gotten cheap.
Cash isn't what it used to be
For years, "cash" meant giving up yield, so holding little of it made sense. That isn't true now. T-bills pay a real income, and shorter Treasuries earn something close to what the long end pays. Investors are choosing to run record-low cash allocations even though cash comes with a yield they haven't seen in years. Recall recent data whereby fixed income is pulling in more than three times the daily inflows of equities in a single day.
What this could mean for fixed income investors
Keep dry powder in T-bills. It's the same point from our piece on the 2000/2007 and 1981 patterns. Liquidity matters most when everyone else is forced to sell.
Build duration gradually. If a late-cycle turn eventually pushes yields lower, quality duration is how bond investors benefit, and a ladder or barbell avoids trying to time the top.
Be careful reaching for yield in credit. Late-cycle conditions are when credit looks safest and tends to be pricier. The 2008 lesson was that credit risk was where the damage was.
Watch credit spreads. Spreads widening is often the earliest warning that the cycle is changing, and it often shows up before stocks react.
The big caveat
Cash allocations drifted lower for years in the 2010s while markets kept climbing, and anyone who sold the moment it looked "low" paid a price. This is a reason to prepare, not a reason to panic.
The bottom line
When almost no one is holding cash, almost no one has the capacity to buy when things get ugly. That's the part of this chart fixed income investors should care about. Treasuries have historically been where money goes when risk appetite turns, and a market this fully invested has a lot of money that might eventually go looking for somewhere safe to land.