
When a magazine like The Economist puts a pressure gauge on its cover, with a red percent sign and an arrow pointing up, you can be sure the story has gone mainstream.
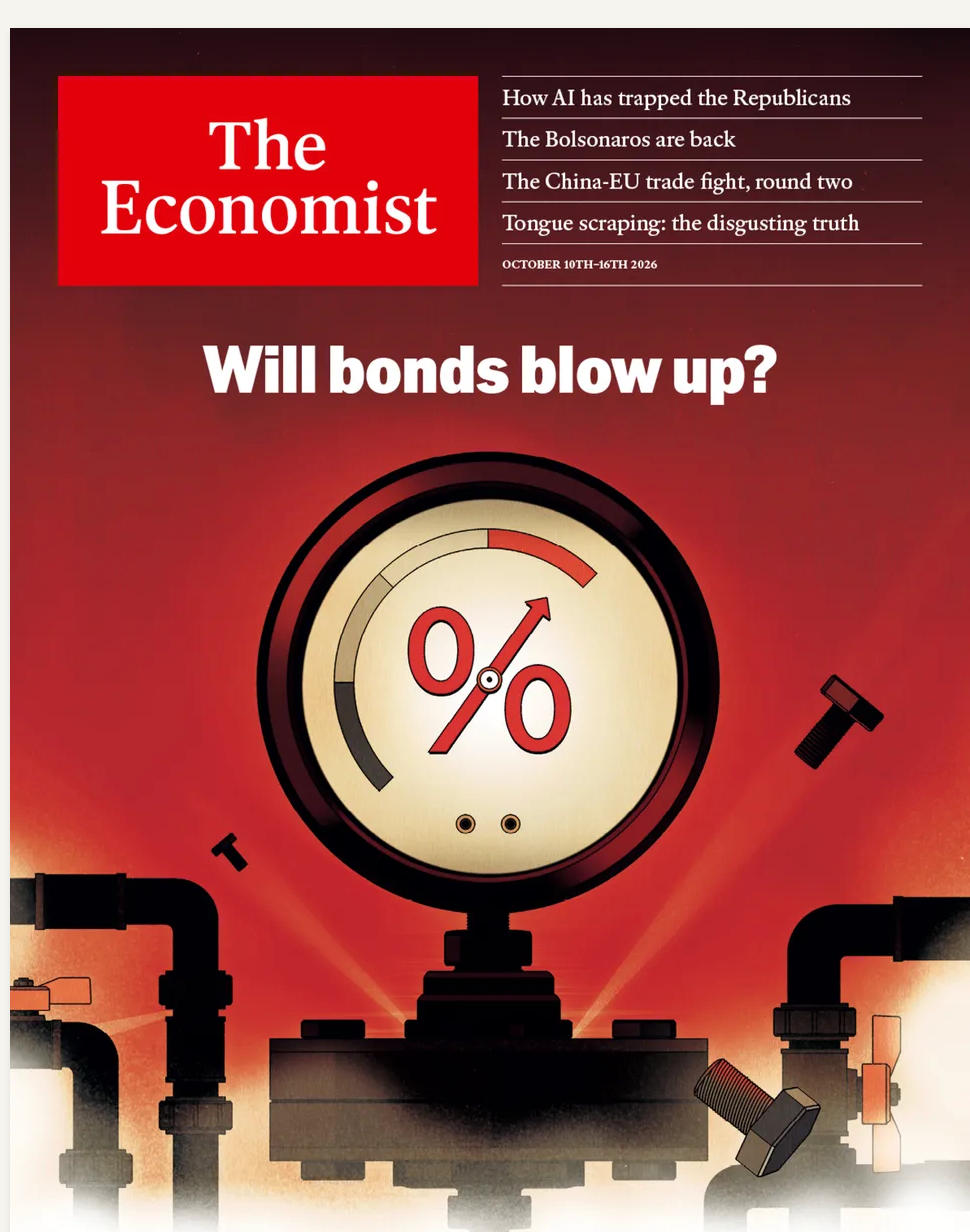
The cover is dated October 10th to 16th, 2026. If you invest in bonds, it's worth taking seriously for two reasons:
- It tells you something real about the market.
- It triggers one of investing's oldest rules of thumb: the magazine cover indicator.
What the cover is reacting to
The Economist's leader, as it's been summarized, says many rich-world governments now pay more to borrow than at any time since the 1990s or 2000s. Five years ago, borrowing was cheap enough that public debt looked almost costless. The magazine argues central banks shouldn't bail out governments that won't balance their books, and warns that if they become "cash machines for finance ministries," long-term bonds will sell off even more.
The market backs up the mood.
The 10-year Treasury is at 5.24% and the 30-year at 5.61%, the highest since 2002 by NBC's account.
Last Wednesday's 10-year auction cleared at 5.300%, the highest auction yield since November 2000.
The 5-year breakeven, the bond market's gauge of expected inflation, is about 2.35%, near its highest of the year. The New York Fed's one-year inflation outlook is the highest since May 2023.
The Fed raised rates on September 16 and futures see more hikes.
Some economists think heavy borrowing by AI companies could add pressure on government bond yields.
What the cover indicator says
The idea is simple: when a mainstream publication puts a theme on its cover, the move may be near a peak, because few buyers or sellers are left. The Economist is one of the most-studied examples.\
A 2016 Citigroup study of 44 Economist covers from 1998 to 2016 found that covers with a clear, strong bias were contrarian 68% of the time after one year.
A more recent analysis of 55 Economist covers since 1997 found a one-year contrarian hit rate around 65%. Bearish covers were the stronger signal, and the reversals tended to be biggest about a year later.
The bond examples worth remembering
The Economist, September 2016: "Living in a low rate world." It ran weeks before one of the fastest selloffs in global fixed income. A cover that said low rates were permanent was a sign that low rates were about to end.
Fortune, August 2010: warnings of a "bond bubble." The 10-year Treasury had just fallen to 2.54%, and strategists warned that "the chase for yield always ends badly." But the article itself argued a big bond bust looked unlikely. From memory, yields kept falling for roughly two more years, and the 10-year dipped below 1.5% in 2012. The bond bubble warning was right about the direction eventually and years too early. Anyone who shorted bonds on the headlines paid dearly.
The cases where covers were wrong or early
BusinessWeek, August 1979: "The Death of Equities." The Dow was about 867 and fell to about 779 three years later, down roughly 32% after inflation, before a bull market that lasted nearly two decades. Right as a contrarian buy signal, three years early.
The Economist, 1999: three covers on the NASDAQ bubble. The bubble burst, but the NASDAQ roughly doubled between September 1999 and March 2000, after the covers ran.
BusinessWeek, 2008: "Meltdown; For Housing the Worst Is Yet To Come." The cover was right and housing kept falling for a year or more. A contrarian who bought lost money.
The cases where it worked: Time's December 1999 Bezos cover near the dot-com peak, and The Economist's 1999 "Drowning in Oil," which marked the low in oil.
Two ways this could go
If the contrarian reading is right, yields at 5% to 5.6% are close to a peak and bonds do better over the next year.
If the cover is right, or just early, yields can keep rising before they fall. The risk is that central banks lose credibility, or that inflation proves stickier, and the long end sells off most. That is the 1999 pattern: right about the theme, wrong about the timing.
You can't know which. That is the point of building a bond portfolio that survives both.
What this could mean for fixed income investors
- Treat the cover as a sentiment reading, not a trade. It tells you the worry is crowded. It doesn't tell you when yields turn.
- Notice what is different from 2010 and 2016. Then, yields were low and the case for the risk was about reaching for yield. Now the 10-year pays 5.24%, and the 5-year at 5.00% with breakevens near 2.35% implies a real yield of roughly 2.6%.
- Respect the long end. The 30-year at 5.61% is where a "blow up" would show up first. Duration is the risk if the cover is right.
- Ladder the middle. Five to ten years gives you most of the yield with less exposure than the 30-year, and the 1-year at 4.48% and the 1-month at 4.16% give you dry powder if yields rise.
- Add TIPS for the inflation case. If the story is inflation and central banks losing credibility, that is the piece designed for it.
- Don't try to time it. The NASDAQ doubled after the 1999 covers. Size positions so you can be early for a year.
- Keep watching the signals that matter. Auction results, credit spreads and the Fed, which are the things this cover is trying to describe.
Bottom line
The Economist asking "Will bonds blow up?" tells you the fear has gone mainstream, and historically that is more often a sign of a turning point than a starting gun. But a cover can be right about the theme and wrong about the date, and a question mark is not a forecast. The sensible response isn't to bet on a blow-up or against one. It's to own bonds you can hold through a bad year, at yields that already pay you for the worry.