
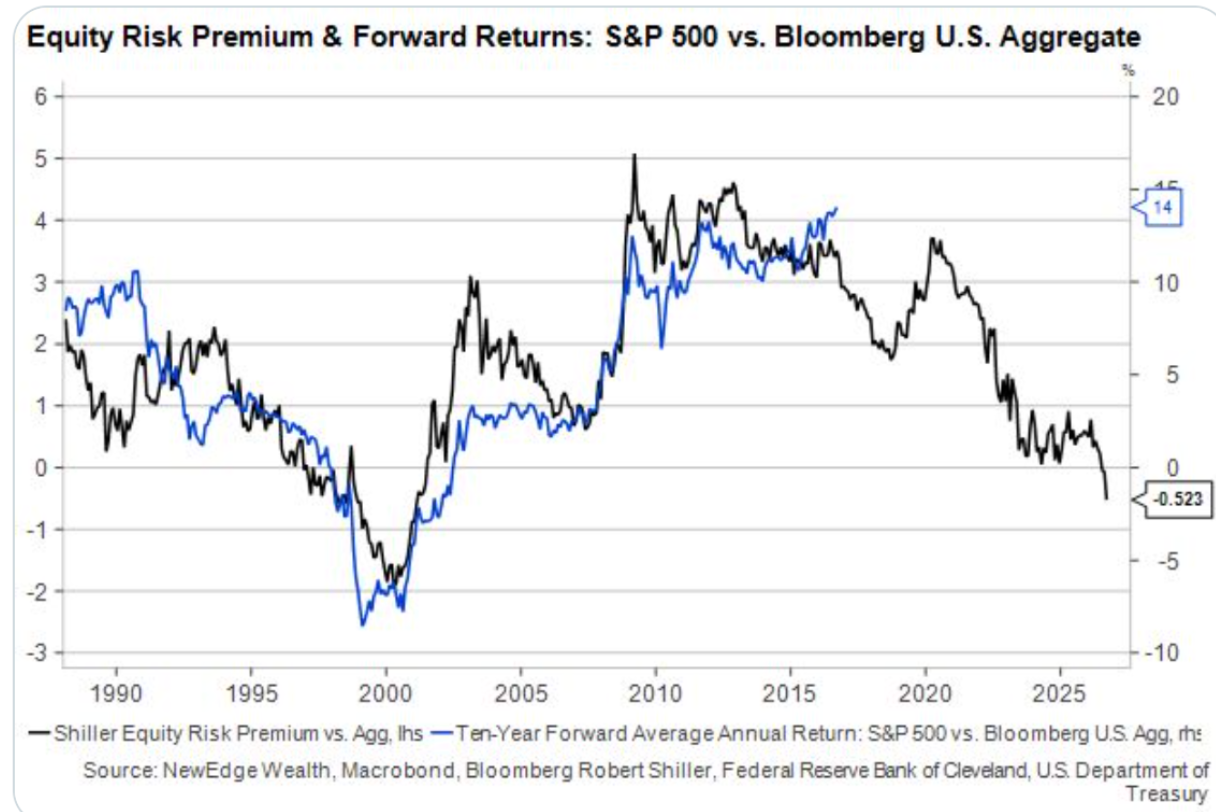
The Bloomberg US Aggregate bond yield is now ABOVE the S&P 500’s earnings yield. The last time, stocks lagged bonds for the next decade.
What is an earnings yield?
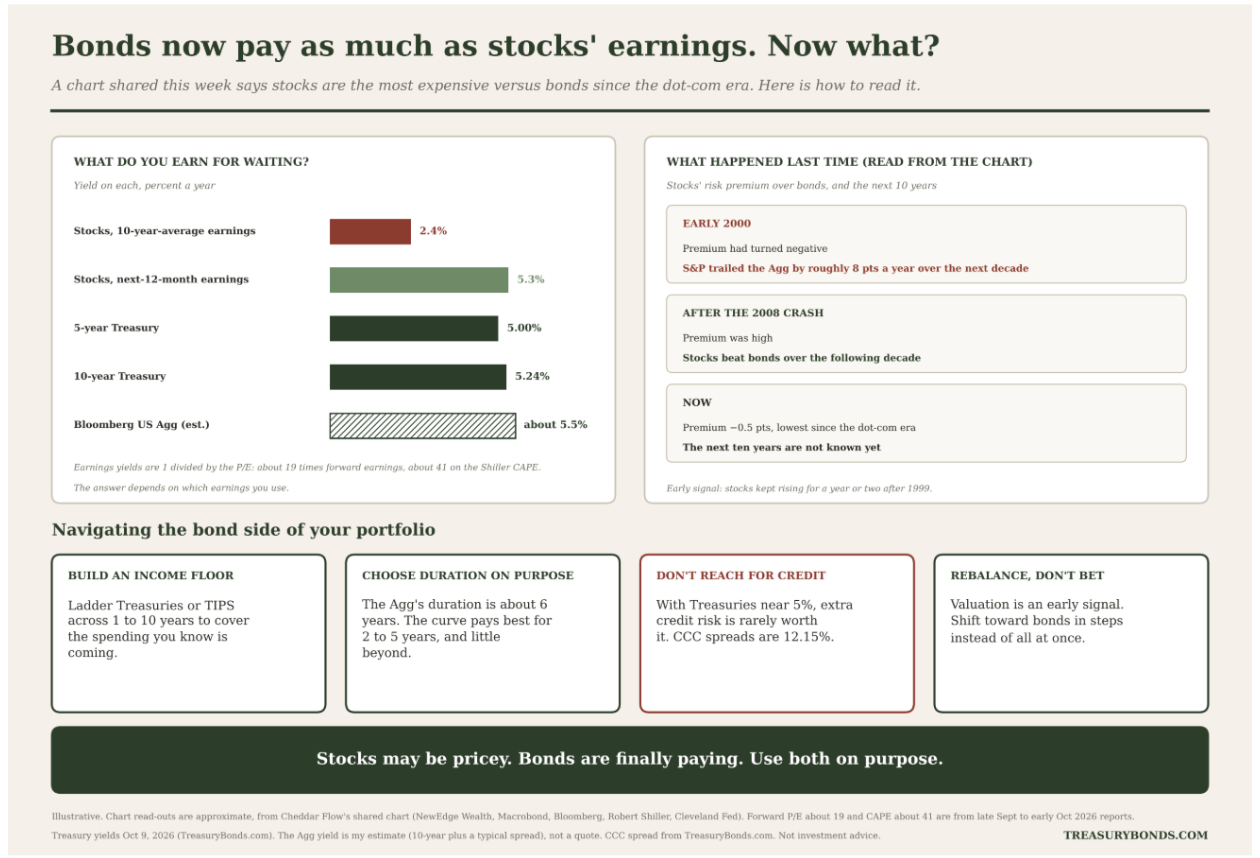
Take the S&P 500’s earnings and divide them by its price. That gives you a yield you can compare to a bond’s yield. It is just the P/E ratio flipped upside down. A P/E of 19 is an earnings yield of about 5.3%. A P/E of 41, which is roughly where the Shiller CAPE sits, is about 2.4%.
The gap between that stock yield and a bond yield is called the equity risk premium. It is the extra payment stocks are supposed to offer for being riskier. In the chart, that premium is now negative, about −0.5 points. It is the lowest reading since the dot-com era.
What the chart shows
The black line is that premium. The blue line is what happened next: how much the S&P 500 beat or trailed the Agg over the following 10 years.
When the premium was deeply negative around 1999 and 2000, the S&P trailed the Agg by roughly 8 points a year over the next decade. When the premium was high after the 2008 crash, stocks won big.
Things to consider
- Definitions matter. On forward earnings (about 5.3%), stocks and bonds are roughly even. On the CAPE (about 2.4%), stocks look much more expensive.
- It’s an early signal, not a timer. The premium went negative in the late 1990s and stocks kept rising for a year or two after.
- The Aggregate isn’t riskless. Its duration is about 6 years, and its 2026 total return is negative so far this year. A yield above stocks’ earnings doesn’t mean a smooth ride.
Why this matters for fixed income investors
For over a decade, “there is no alternative” was the stock market’s favorite phrase. Bonds yielded so little that you had to own stocks. That argument has weakened. The 10-year Treasury was 5.24% on Oct 9, the highest levels since about 2002. The 5-year was 5.00%.
You can now earn roughly what the stock market’s earnings pay, with a government guarantee on the principal if you hold to maturity.
What this means for fixed income investors
Build an income floor. Ladder Treasuries or TIPS across 1 to 10 years to cover spending you know is coming. This part of your portfolio is about certainty.
Choose your duration on purpose. The Oct 9 curve pays best for the 2 to 5 year range. Moving from 5 to 10 years added only about 7bp of yield per extra year of duration. A 10-year bond at 5.24% has about 68bp of cushion: yields would have to rise about 0.7 points in a year to erase the interest earned. The 30-year at 5.61% yields less than the 20-year (5.66%), so I wouldn’t reach for the long end.
Know what’s inside your bond fund. An Agg fund carries about 6 years of duration. Know that number before you add more.
Don’t reach for credit. With safe Treasuries near 5%, the extra risk in lower-quality bonds is rarely worth it. CCC spreads are 12.15%, which tells you the market is pricing real stress there.
Look at munis and TIPS. Depending on your tax bracket and inflation concerns, these can beat plain Treasuries after taxes or inflation.
Rebalance, don’t bet. If you’ve let stocks run, shifting some money to bonds in steps is reasonable. Going all-in on one chart is not.
Bottom line
Stocks may be expensive as some could imply from the chart. The better news is on the bond side: for the first time in about 20 years, you can be paid fairly to wait. Use both, on purpose, and match your bonds to when you’ll need the money.