
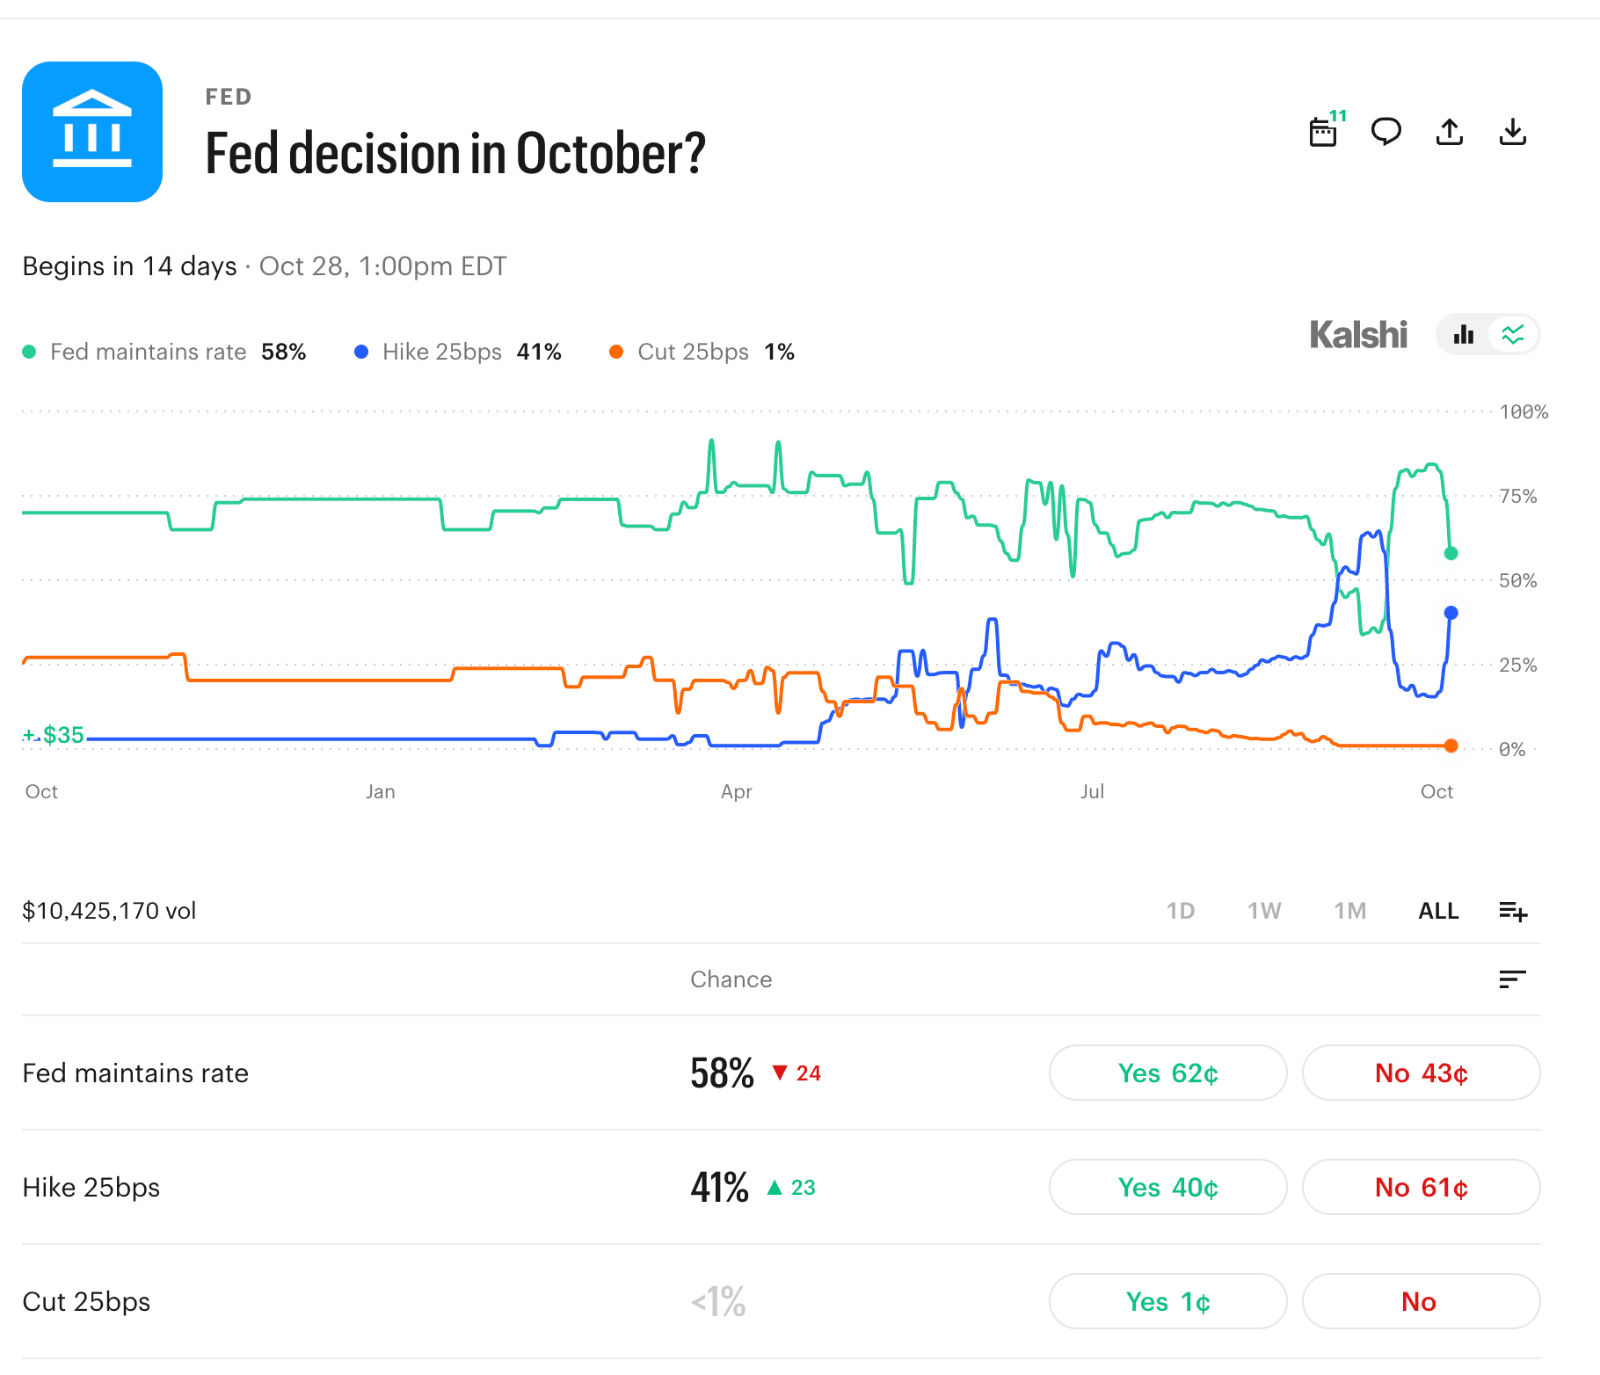
I like to peek at how the prediction markets react first and you can see the blue line spike on the chart below for what some are now positioning again for - a rate hike of .25 basis points.
Price changes over last year, per September CPI report:
- Fuel Oil: +74.0%
- Gasoline: +34.2%
- Gas Utilities: +5.0%
- Electricity: +4.4%
- Overall CPI: +3.7%
- Food away from home: +3.5%
- Apparel: +3.4%
- Shelter: +3.2%
- Transportation: +2.7%
- Medical Care: +2.5%
- Food at home: +1.8%
- New Cars: +0.6%
- Used Cars: -1.5%
Food away from home is up 3.5%, apparel 3.4%, shelter 3.2%, transportation 2.7%, medical care 2.5%, and groceries only 1.8%. New cars are barely higher at 0.6%, and used cars are actually down 1.5%. So the pain at the pump and on the heating bill is real, but it isn’t yet spreading evenly through everything else.
For fixed income investors, that’s the question to watch: whether energy is a one-time shock that fades, or whether it leaks into shelter, services, and food and keeps the Fed and Treasury yields under pressure.