
Here’s something I learned in my many years of trading: the news tells you what happened. The market’s reaction tells you what’s already priced in.
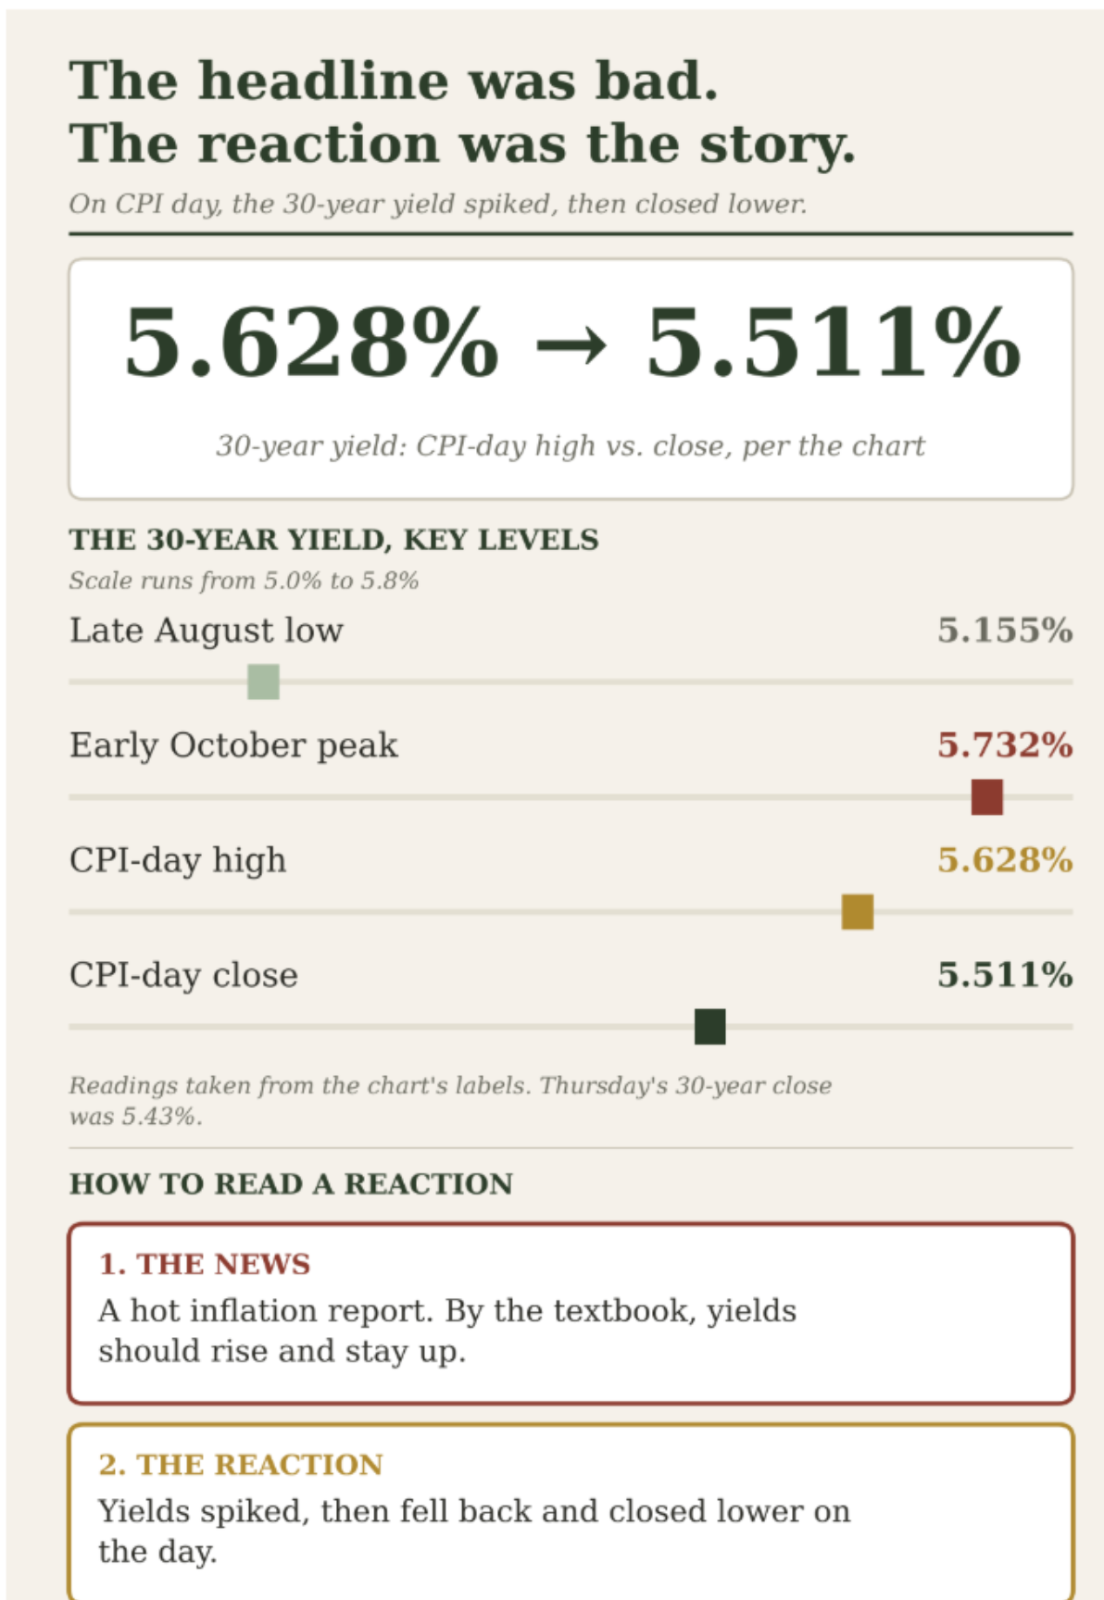
Look at the 30-year Treasury chart. A bad CPI report hit, and the textbook response is easy: inflation is hot, so yields should rise and stay up.
For a few hours, they did. The 30-year yield spiked to about 5.628%. Then buyers showed up, and it closed the day lower, near 5.511%.
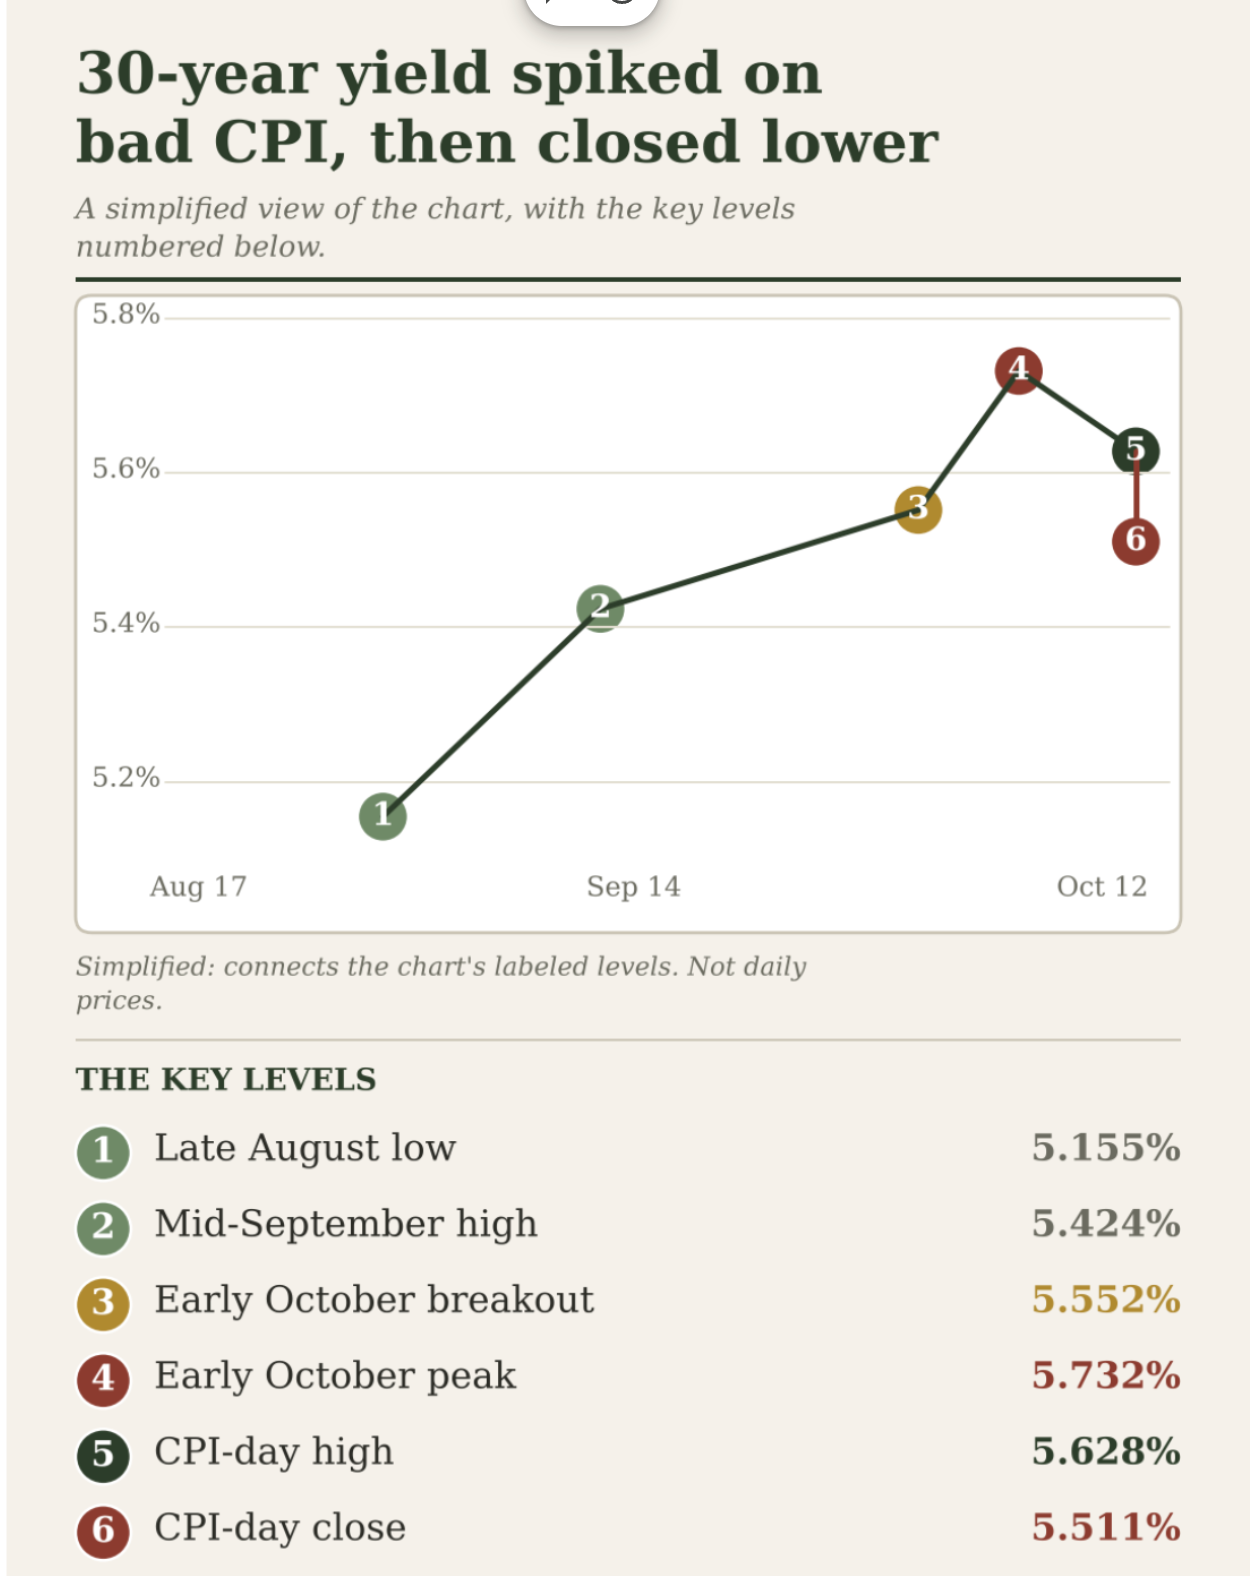
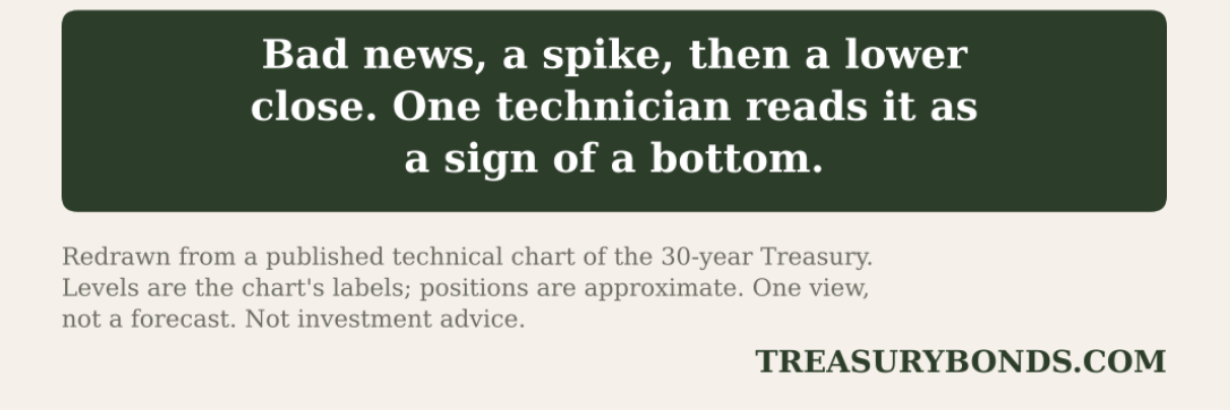
When a market gets bad news and can’t go the way the news says it should, that tells you something. It can mean most of the sellers have already sold. The commentary on the chart calls it a market that’s “sold out,” and says that when a market doesn’t respond rationally to bad news, a trend reversal is more likely.
Why the reaction can matter more than the headline
Headlines are known by everyone at the same time. The edge isn’t in reading the number. It’s in watching what people do with it.
Positioning matters. If everyone is already leaning one way, the next piece of news in that direction has less fuel left.
Closes beat spikes. Where the market finishes tells you more than where it trades in a panic at 8:30 a.m.
Markets lead the story. Sometimes the price turns before the data, and the explanation shows up afterward.
What this could mean for fixed income investors
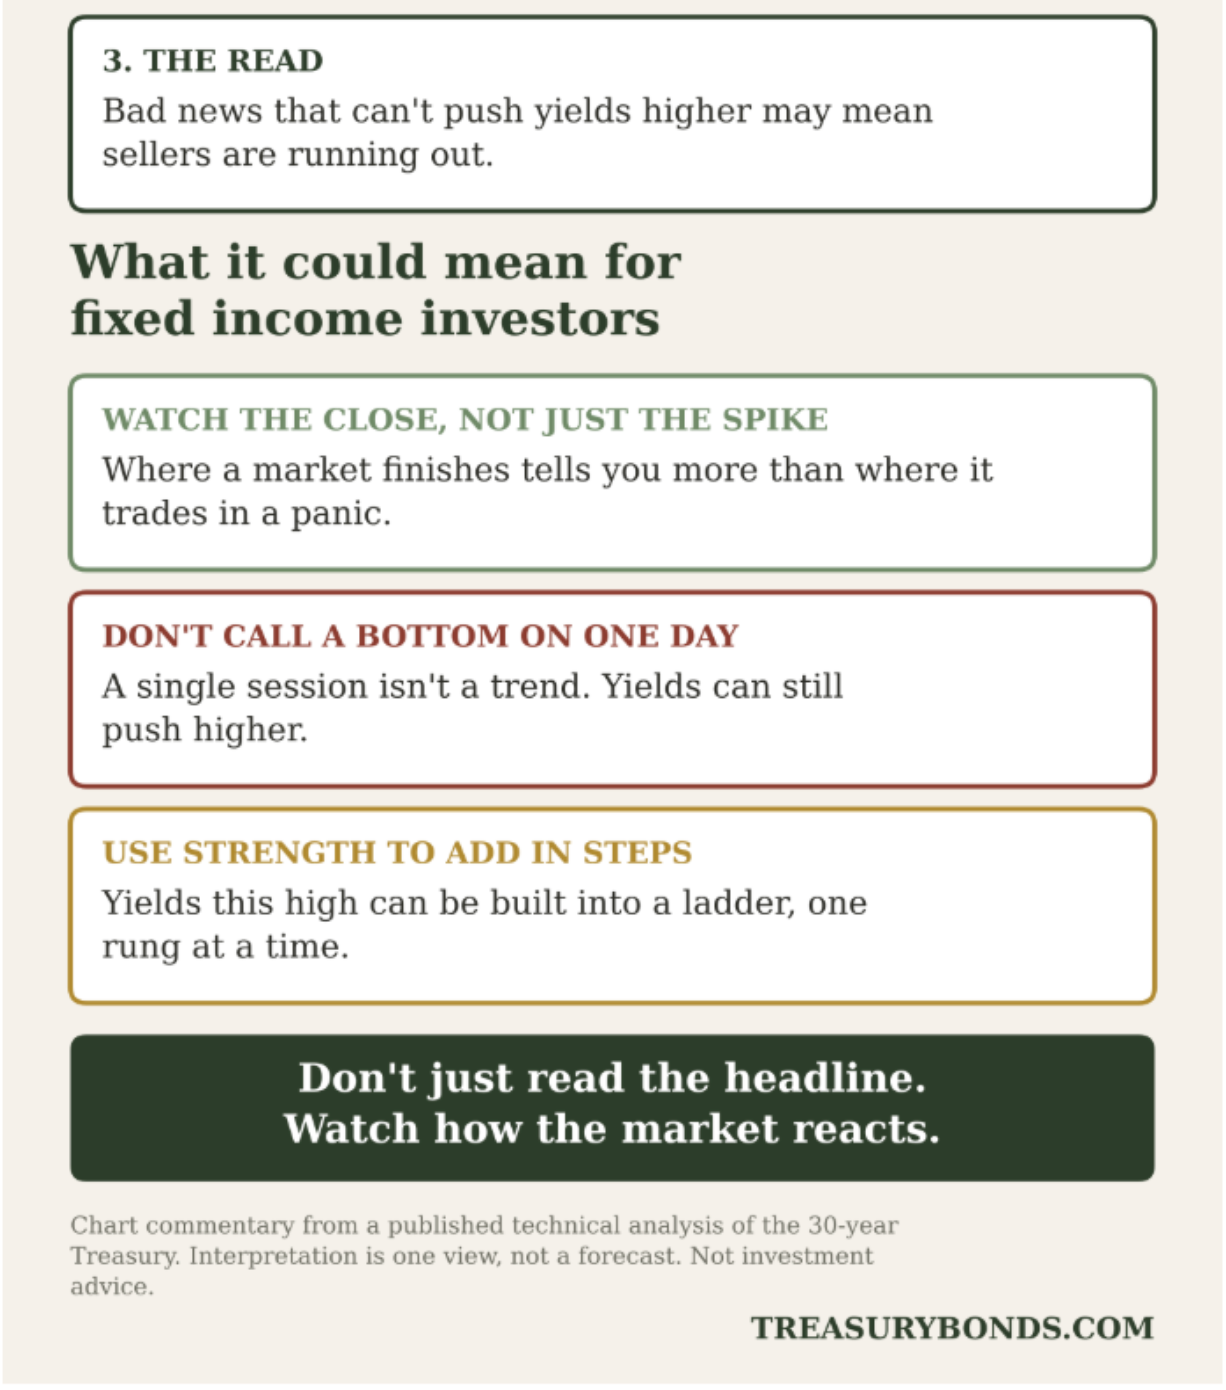
Watch the close, not just the spike. A big intraday move that fully reverses is information.
Don’t call a bottom on one day. A single session isn’t a trend. Oil near $100 and a hot PPI are still real risks to yields.
Use rallies to add in steps. If you believe yields are attractive, a ladder lets you build one rung at a time instead of betting on the exact top.
Pair data with price. After each big report, ask two questions: what did the number say, and what did the market do?
Bottom line
Don’t just read the headline. Watch how the market reacts.