
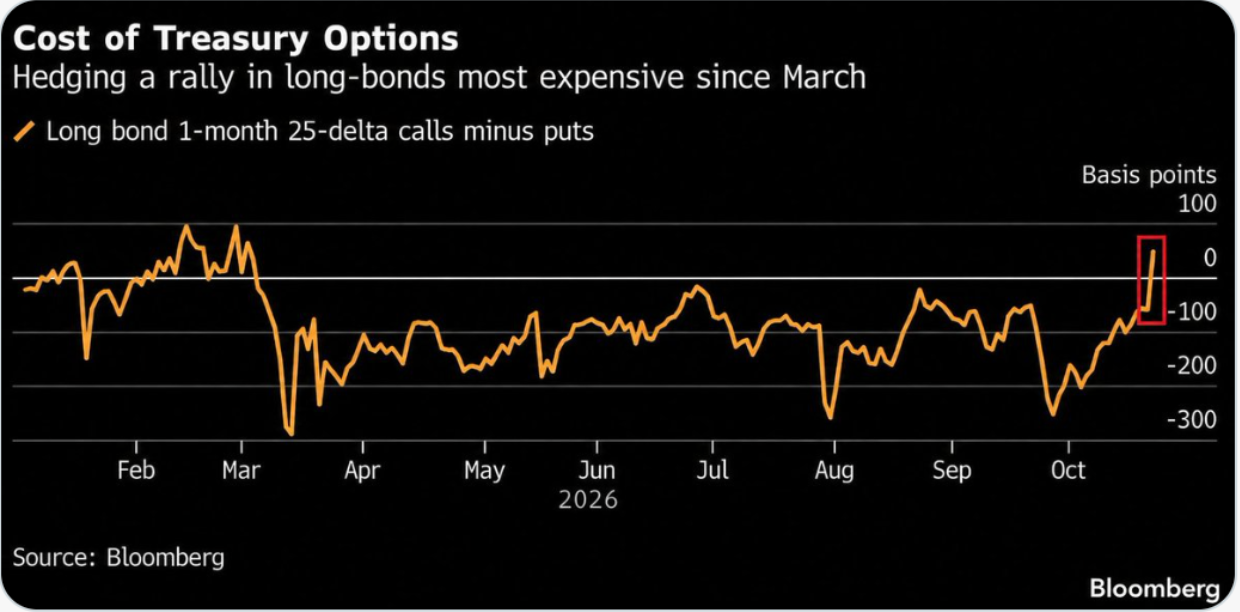
A chart from Bloomberg shows a big shift in the long-bond options market.
What the chart shows
The measure compares the price of long-bond call options to put options. Specifically, it’s the one-month, 25-delta calls minus puts.
When the number is below zero, puts cost more. When it’s above zero, calls cost more.
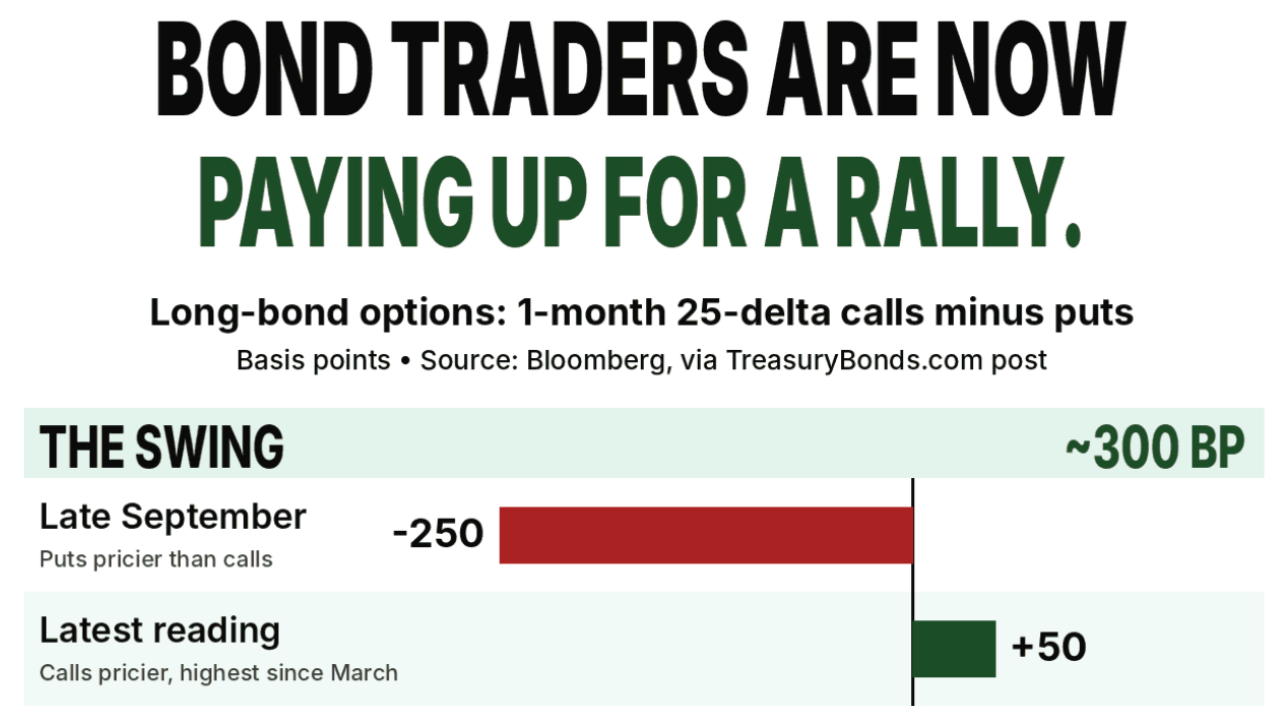
In late September, the reading was near minus 250 basis points. Puts were relatively expensive, which tells you traders were worried about a selloff and were paying up to protect against it. The latest reading is roughly plus 50, with calls at their largest relative premium since March.
That’s about a 300-basis-point swing in a matter of weeks.
Here’s an easier visual to understand:
Why that matters
Options prices reflect what people are willing to pay to hedge or bet on a move.
A shift from “protect me from a selloff” to “protect me from a rally” is a real change in mood.
It could mean investors who were short or underweight long bonds now worry about being caught offside if yields fall.
It could also reflect growing concern about a growth scare, a flight to safety, or a pause in the rise in long-term rates.
The long-bond options market has gone from paying up for protection against a selloff to paying up for protection against a rally. For investors, it’s a reminder that fear can shift faster than yields do.